Dolby Log Analyzer Front End User Manual
1 What is Dolby Log Analyzer?
Dolby Log Analyzer is a web application that scans Dolby D-cinema log files to quickly produce an overview of a unit and identify known issues and recommended upgrade.
2 Overview
2.1 Uploading a Log File

Dolby Log Analyzer Web User Interface
Drag a log file into the drop zone or use the Browse button:
- Make sure the log file is from a currently supported product.
- The log file must be uploaded as it was generated by the Product. (do not modify, rename or re-zip)
- Make sure the log file does not exceed the maximum allowed size.
2.2 Wait while the log file is been uploaded and analyzed

Dolby Log Analyzer Uploading a Log File
2.3 The analysis output

Output Layout
2.3.1 Snapshot

Snapshot Layout
The Snapshot displays information about the product. e.g.: Hardware, software version and configuration.

Snapshot Tabs
Information is classified by theme under dedicated tabs.

Snapshot Notification
Hold your mouse on a highlighted Item to view the notifications.
2.3.1.1 Snapshot Notifications
A Snapshot Item is highlighted if a notification is assigned to it.
 |  |  |  |  |
| Versioning in purple | Notice in blue | Warning in orange | Error in red | Fatal in white on red background |
Snapshot Notification Severities
The highlight color matches severity of the notification.

Snapshot Tab Notification Badges
A badge is displayed next to each tab displaying the number of hold notifications in the color of the highest notification severity.
2.3.1.2 Snapshot Helps
|  |
Snapshot Help
If available hold your mouse on the Snapshot Item question mark to view the Help.
2.3.2 Time Filter
![]()
Time Filter
- This is to narrow down the analysis to the most relevant information.
- The Time Filter only affects the Analysis Body. It does not affect the Snapshot.

Time Filter Default Settings
- The date used as a reference is the date the log file has been generated.
- By default only the last 7 days of logs are analyzed.
 |
|
Personalizing Time Filter Settings
The analysis time frame can be personalized using the calendar that pops up by clicking any of the dates.
![]()
Time Filter On
The Time Filter can be turned on and off by clicking the calendar button.
![]()
Time Filter Off
Validate any Time Filter change by clicking the yellow refresh button.
2.3.3 Analysis Body
|
Analysis Body Layout |
2.3.3.1 Contextual help

Contextual Help Layout
- A Severity Icon
- A Title
- A Body
- Snapshot Item value evaluation
- Log file scanning
2.3.3.1.1 Contextual Help based on Variable evaluation

Contextual Help title matches the Snapshot Notification
2.3.3.1.2 Contextual Help based on Log File scanning

Contextual Help Log Lines
In case of Contextual Help triggered by a message showing up in a log file, the corresponding log lines will be displayed.

Contextual Help Log Lines Layout
- Only the 10 last error occurrences are displayed.
- To see them all click the expand icon.
- Available archived versions of log file are also scanned as long as the time stamp meets the Time Filter settings.
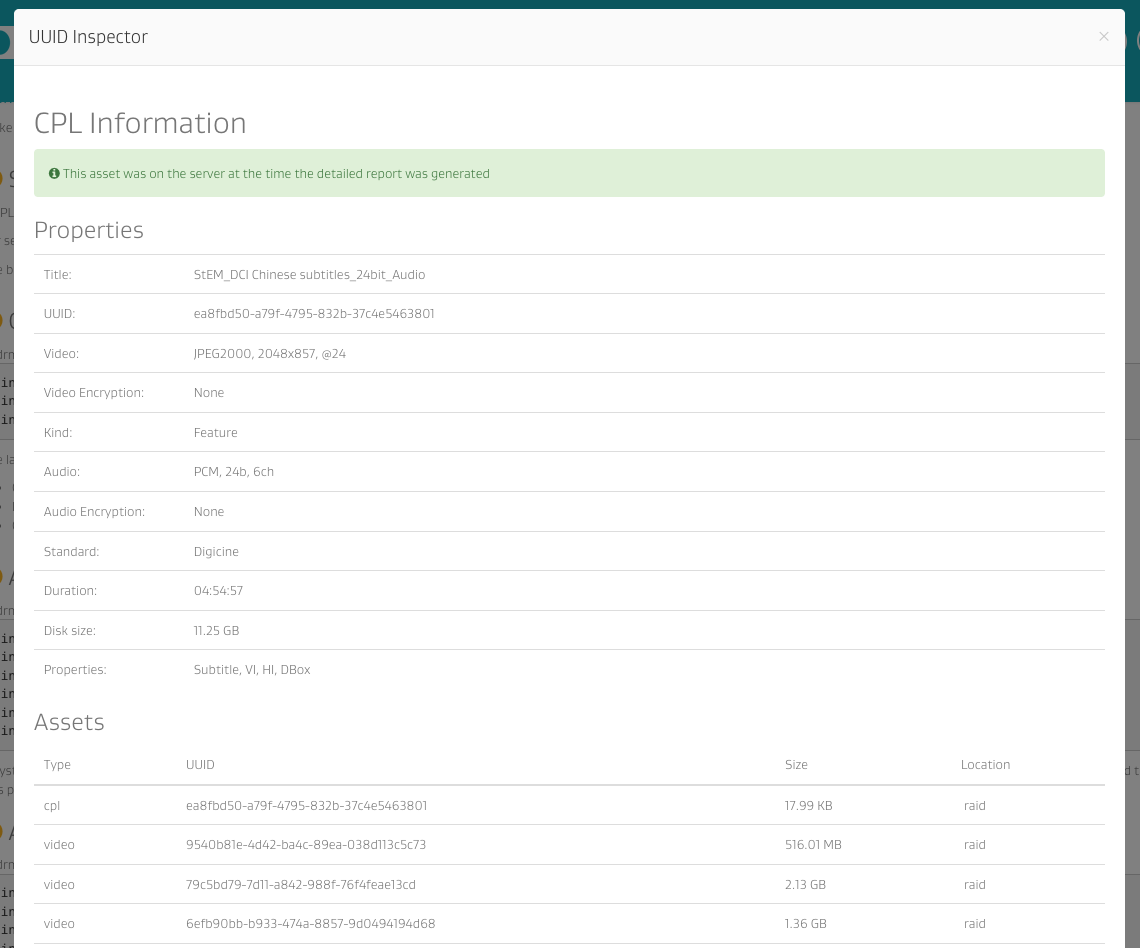
2.3.3.1.3 UUID Inspector
The UUID Inspector makes any UUID clickable to show in a popup window all information available in the report: Asset type, Asset properties, asset list, and asset history:

Clickable UUIDs

UUID Inspector


